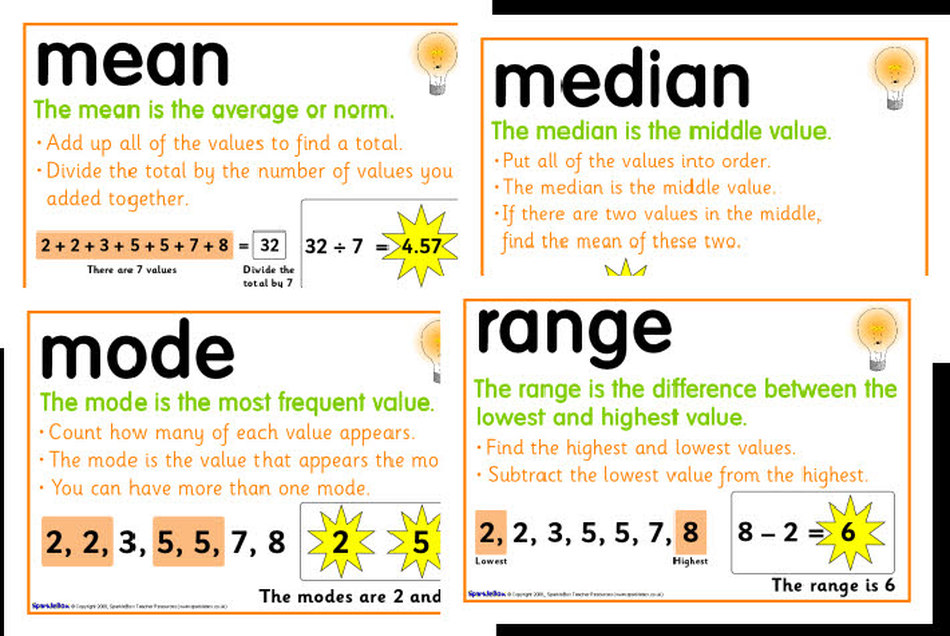
Measures of Central tendency
Outliers

These are values distant from the majority of the data. Outliers have a greater effect on means than on medians.
Weighted Mean
Weighted mean gives a measure of central tendency that reflects the relative importance of data (one value may be more important than another).
For example: Imagine the following information shows your test marks
For example: Imagine the following information shows your test marks
Knowledge
|
Application
|
Thinking
|
Communication
|
Your teacher puts a weight (importance) of 40% on knowledge, 25% on application, 20% on thinking and 15% on communication. Then your weighted mean is
Weighted mean = (75*0.4 + 68*0.25 + 80*0.20 + 65*0.15)/(0.40 + 0.25 + 0.20 + 0.15) = 72.75
Your mark of 72.75 is calculated using you raw test score, weighted proportional to its importance.
Weighted mean = (75*0.4 + 68*0.25 + 80*0.20 + 65*0.15)/(0.40 + 0.25 + 0.20 + 0.15) = 72.75
Your mark of 72.75 is calculated using you raw test score, weighted proportional to its importance.
